
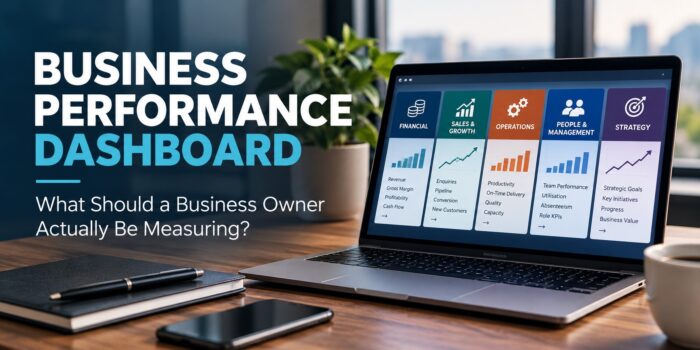
 Business Performance Dashboard: What Should a Business Owner Actually Be Measuring?
Running a business has never produced more data. Yet many established business owners still struggle to see clearly how their business is actually performing.A well-designed Business Performance Dashboard solves this problem by bringing the measures that matter into one management view — helping owners and managers see what is performing as expected, what isn’t, what is changing, and where action is required.
Accounting software can tell you revenue, expenses, margins and cash flow. CRM systems can report enquiries, opportunities and sales. Operational systems can track jobs, productivity, utilisation and delivery. HR systems can measure attendance, turnover and labour costs.
Yet having access to all this information doesn’t necessarily answer some surprisingly basic questions.
Is the business actually performing as well as it should be?
Where are we falling behind?
Why is it happening?
What requires management attention right now?
The problem is rarely that the business doesn’t have enough data. More often, management hasn’t determined which information actually matters, what good performance looks like, and what should happen when performance moves away from target.
That’s the real purpose of a Business Performance Dashboard.
A good dashboard doesn’t simply tell you what happened.
It tells management where attention and action are required.
What Is a Business Performance Dashboard?
A Business Performance Dashboard is a deliberately selected set of measures that gives an owner and management team a clear view of how the business is performing against its objectives.
That distinction matters.
A dashboard shouldn’t simply be a collection of everything the business is capable of measuring.
It should help management quickly answer four questions:
- What is performing as expected?
- What isn’t?
- What is changing?
- Where do we need to take action?
This is where many business dashboards go wrong.
Businesses frequently build dashboards around the information that is easiest to obtain rather than the information that is most useful to manage.
Revenue, profit and cash are obviously important. But they mostly tell you the result of things that have already happened.
Effective business management requires visibility of both the results and the activities, behaviours and operational conditions that create those results.
The Difference Between Reporting and Managing
There is an important difference between a business report and a management dashboard.
A report provides information.
A management dashboard should help create management action.
Imagine that monthly revenue is 15% below target.
Knowing that number is useful, but it doesn’t tell management what to do next.
Management may need to know:
- Are enquiries down?
- Has conversion fallen?
- Has average transaction value changed?
- Is the sales pipeline insufficient?
- Are projects being delayed?
- Has productive capacity fallen?
- Is work being completed but not invoiced?
- Is one division, product or salesperson responsible for most of the variance?
The revenue figure identifies the symptom.
The management system needs to help identify the cause.
This is why an effective Business Performance Dashboard needs more than financial results.
The Mistake of Measuring Too Much
Once businesses decide they need KPIs, there is a temptation to measure everything.
Modern software makes that remarkably easy.
But having 50, 80 or 100 metrics on a dashboard doesn’t necessarily give management greater control. In many cases, it creates the opposite.
Important information becomes buried amongst numbers that don’t materially influence management decisions.
A useful principle is:
If a measure changes significantly, should somebody in management be expected to do something about it?
If the answer is no, there is a legitimate question about whether that measure belongs on the primary management dashboard.
That doesn’t mean the information has no value. Detailed operational reports can exist underneath the dashboard.
But the management dashboard should remain focused on the relatively small number of measures that tell management whether the business and its major functions are performing as intended.
Leading Indicators vs Lagging Indicators
One of the most important principles in business performance measurement is understanding the difference between leading and lagging indicators.
Lagging indicators
Lagging indicators tell us what has already happened.
Typical examples include:
- Revenue
- Gross profit
- Net profit
- Cash flow
- Customer losses
- Staff turnover
- Completed jobs
- Warranty claims
These measures are important because they tell us whether the business ultimately achieved the required result.
The problem is timing.
By the time a lagging indicator reveals poor performance, the causes may have existed for weeks or months.
Leading indicators
Leading indicators measure activities or conditions that are likely to influence future results.
Depending on the business, these might include:
- Number of qualified enquiries
- Sales appointments
- Quotes submitted
- Sales conversion rate
- Forward order book
- Sales pipeline value
- Productive utilisation
- Jobs completed on schedule
- Production output
- Rework levels
- Customer response times
- Project milestones achieved
If revenue falls this month, management can only respond after the event.
If qualified enquiries, quote activity and forward orders begin falling three months earlier, management potentially has time to intervene before revenue is affected.
A strong Business Performance Dashboard therefore combines leading and lagging indicators.
What Should a Business Performance Dashboard Actually Measure?
There is no universal list of KPIs that every business should use.
A construction company, professional services firm, manufacturer, wholesaler and healthcare provider operate very differently.
Their dashboards should reflect those differences.
However, most established SMEs need visibility across several broad areas of business performance.
1. Financial and Commercial Performance
Financial measures remain essential.
Depending on the business, management may need visibility of:
- Revenue
- Gross profit
- Gross margin percentage
- Operating profit
- Net profit
- Cash position
- Accounts receivable
- Debtor days
- Work in progress
- Labour costs
- Overheads
- Budget versus actual performance
The objective isn’t to replicate the entire profit and loss statement on a dashboard.
It’s to identify the financial measures that tell management whether the commercial engine of the business is performing properly.
For some businesses, gross margin percentage may be more useful than revenue alone.
A company can increase sales substantially while becoming less profitable if pricing, labour productivity, purchasing or job costing deteriorate.
Growth without commercial control can simply create a larger, busier and less profitable business.
2. Sales and Growth Performance
Revenue tells you what you sold.
Sales performance measures help explain how future revenue is being created.
Useful measures might include:
- Enquiries generated
- Qualified opportunities
- Sales pipeline value
- Quotes or proposals submitted
- Conversion rate
- Average sale value
- Sales cycle length
- New customers acquired
- Existing customer retention
- Recurring revenue
- Forward orders
Again, the correct measures depend on the business model.
The objective is to identify the relatively small number of activities that reliably influence future sales performance.
This allows management to identify problems earlier.
3. Operational Performance
A profitable order isn’t particularly useful if the business cannot deliver it efficiently.
Operational measures help management understand what happens between winning the work and producing the commercial result.
Depending on the organisation, useful measures might include:
- Labour productivity
- Billable or productive utilisation
- Jobs completed
- On-time delivery
- Production output
- Project performance
- Job profitability
- Rework
- Defects
- Customer complaints
- Capacity utilisation
- Stock or inventory performance
- Service response times
This is often where growing businesses develop hidden problems.
Sales increase, but operational capacity, processes and management disciplines don’t develop at the same rate.
Revenue continues growing while overtime, errors, delays, rework and management workload quietly increase underneath it.
By the time profitability deteriorates, the operational causes may have existed for a considerable period.
4. People and Management Performance
People performance is often discussed subjectively.
Someone is “doing well”, “struggling”, “very busy” or “needs to improve”.
Effective management requires greater clarity.
Where appropriate, a Business Performance Dashboard can include measures relating to:
- Role-specific KPIs
- Team productivity
- Labour utilisation
- Absenteeism
- Staff turnover
- Training or competency development
- Recruitment performance
- Management actions completed
- Key responsibilities achieved
The purpose isn’t to turn people into numbers.
It’s to create clarity about what successful performance looks like.
When roles, responsibilities, targets and measures are clear, performance conversations become substantially more objective.
5. Strategic Progress
One of the most commonly overlooked areas of business measurement is strategy itself.
A business can hit this month’s revenue target while making almost no progress toward the organisation the owner is trying to build.
For example, the strategic objective might be to:
- Reduce dependency on the owner
- Build a capable management team
- Enter a new market
- Increase recurring revenue
- Improve gross margin
- Develop a second operational team
- Reduce reliance on one major customer
- Increase production capacity
- Prepare the business for succession or sale
Those objectives should eventually translate into measurable outcomes.
Otherwise strategy can become something discussed at an annual planning meeting and then forgotten while everybody returns to running the business.
A good performance management system connects long-term strategic direction with short-term management activity.
Every KPI Needs Context
A number on its own doesn’t tell management very much.
Suppose a dashboard shows a sales conversion rate of 31%.
Is that good?
The answer depends on what the target is, what it was previously, why it has changed and who is responsible for managing it.
This creates an important management relationship:
Measure → Target → Variance → Accountability → Action
Measure: What are we monitoring?
Target: What result should we be achieving?
Variance: How far are we from the expected result?
Accountability: Who is responsible for managing this area?
Action: What are we going to do about the variance?
Without those relationships, KPIs easily become statistics that everybody looks at but nobody manages.
Why Business Dashboards Fail
A business can build a technically excellent dashboard and still achieve very little from it.
That’s because the dashboard itself doesn’t improve performance.
Management does.
Common reasons dashboards fail include:
- Too many measures
- Measures that don’t relate to business objectives
- No agreed targets
- Unreliable or inconsistent data
- Nobody clearly accountable for individual measures
- Results reviewed too infrequently
- Management meetings that don’t use the dashboard
- Poor results discussed without actions being assigned
- Actions agreed but never followed through
- KPIs becoming a reporting exercise rather than a management discipline
This leads to an important distinction:
A dashboard is not a management system. It is a component of a management system.
The real value comes from what happens around it.
How KPIs, Dashboards and Management Meetings Should Work Together
A well-designed dashboard should become part of the management rhythm of the business.
The process is relatively simple:
Performance is measured → variance becomes visible → causes are discussed → actions are agreed → responsibility is assigned → progress is reviewed.
The next management meeting then closes the loop.
Were the actions completed?
Did they improve the result?
Has the measure returned to target?
Is further intervention required?
This creates a continuous management cycle rather than a monthly reporting exercise.
It also changes management meetings.
Instead of spending most of the meeting exchanging updates, management can focus its time on exceptions, decisions, problems and actions.
That’s where a dashboard begins to contribute directly to business performance.
Do SMEs Need Expensive Business Intelligence Software?
Not necessarily.
There are sophisticated Business Intelligence platforms capable of automatically combining information from multiple systems and presenting it through impressive real-time dashboards.
For some organisations, that’s extremely valuable.
But technology doesn’t solve the fundamental management problem.
A beautifully automated dashboard containing the wrong KPIs is still the wrong dashboard.
For many established SMEs, a well-designed spreadsheet or relatively simple dashboard can be remarkably effective.
The important questions come first:
What do we need to know?
Why does it matter?
What result are we expecting?
Who is accountable for it?
What will management do when performance moves away from target?
Once those questions are answered, the appropriate technology becomes much easier to determine.
The Business Performance Dashboard as Part of a Management System
At The3rdGear, we’ve found that performance measurement works best when it is integrated with the broader management structure of the business.
Our approach to Business Performance Systems connects areas that are too often managed separately:
Strategy & Direction — where the business is going.
Commercial Performance — whether the business model is producing the required financial outcomes.
Operations & Processes — whether work is being delivered efficiently and consistently.
Leadership & Accountability — who is responsible for producing the required results.
Performance & Insight — whether management has the information needed to understand performance and make decisions.
A Business Performance Dashboard sits within that final dimension, but it draws information from all of them.
That’s why simply installing dashboard software rarely fixes an underlying management problem.
The measures need to reflect the strategy, economics, operational drivers and management responsibilities of the business.
When Does a Business Need Help Building a Performance Management System?
Some businesses can develop an effective dashboard internally.
Others reach a point where the difficulty isn’t producing more reports — it’s determining what management actually needs to know.
A business may benefit from specialist management support when:
- Management has plenty of data but poor visibility of overall performance
- Financial results regularly contain surprises
- Revenue is growing but profitability isn’t
- Managers aren’t clear about which results they own
- KPIs exist but don’t influence behaviour or decisions
- Management meetings generate discussion but little follow-through
- Different departments optimise their own results without understanding the effect on the overall business
- The owner still needs to personally monitor everything to feel in control
- Strategic objectives aren’t translating into measurable management priorities
These are often signs that the problem is larger than the dashboard itself.
The business may need a more integrated performance management system connecting strategy, measures, management responsibilities, meetings and action.
From Measuring the Business to Managing the Business
The best Business Performance Dashboard isn’t necessarily the one with the most data, the most sophisticated software or the most impressive graphics.
It’s the one that helps management see what matters.
A useful dashboard creates a clear line between:
Objectives → Measures → Targets → Accountability → Management Action → Results
When those elements work together, the dashboard stops being something management looks at once a month.
It becomes part of how the business is managed.
And that is ultimately the point.
About The3rdGear
The3rdGear works with established Australian SMEs to develop practical Business Performance Systems that bring strategy, commercial performance, operations, leadership, accountability and management information together.
Our Management Dashboard methodology forms part of that approach, helping business owners and management teams identify the measures that matter and use them as part of an effective management rhythm — rather than simply producing more reports.